


A UV water treatment system should be selected for the dose it can deliver under the conditions where it will operate. Electrical wattage is useful for planning power supply and running costs, but it cannot establish microbial performance by itself. For distributors, OEM brands and water treatment integrators, matching the reactor to peak flow, water quality and the treatment objective is the more reliable starting point.
Published reactor tests and regulatory dose data explain why. The same equipment can deliver different results as operating conditions change, while different microorganisms require different doses. The following examples separate historical measurements, regulatory values and illustrative calculations so each conclusion can be checked.
Understand what the wattage describes
Before comparing two quotations, establish whether the stated watts describe total electrical consumption, lamp input or emitted UV optical power. These are different quantities. A higher electrical rating does not tell a buyer how much germicidal light reaches microorganisms throughout the reactor.
UV dose combines exposure intensity and time. Under constant, uniform exposure, 2 mW/cm² for 20 seconds gives 40 mJ/cm². This is a teaching calculation, not a flow reactor performance claim. Real water follows different paths through regions of different intensity, producing a distribution of doses. Reactor geometry and hydraulics therefore matter alongside the light source.
Wattage remains important: additional usable UV output can increase treatment capacity. The purchasing mistake is treating electrical input as a substitute for evidence of delivered performance.
Flow changes performance at the same power setting
Tests documented in the US EPA's UV Disinfection Guidance Manual provide a useful example. With eight lamps operating at a 60% power setting, flows of 9.7, 4.9 and 2.0 million US gallons per day produced measured MS2 reduction equivalent doses of 39.4, 58.4 and 112.7 mJ/cm², respectively. UVT was similar, but not identical: 87.4%, 87.8% and 88.0%.
The lowest flow corresponded to approximately 2.86 times the measured dose at the highest flow. Power setting alone therefore did not describe performance. These historical results illustrate the importance of matching flow to the reactor; they are not a universal sizing curve.
MS2 was the test microorganism, and reduction equivalent dose is not the final validated dose. The tests preceded the final guidance, which notes differences in data analysis and validation factors. Use the results to understand the relationship, not to assign capacity to another system.
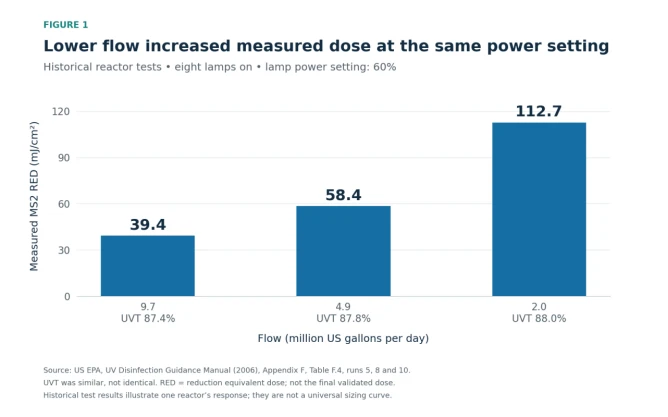
Figure 1. Historical measured MS2 reduction equivalent dose at a fixed lamp power setting. Source: US EPA, 2006, Table F.4.
Match the dose to the microbial objective
A claim such as "99.99% inactivation" is incomplete unless it identifies the organism and test conditions. Four log inactivation represents 99.99%, but achieving that reduction is not equally demanding for every microbial target.
The US regulatory table in 40 CFR 141.720(d)(1) lists four log treatment credit doses of 22 mJ/cm² for Cryptosporidium, 22 mJ/cm² for Giardia lamblia and 186 mJ/cm² for virus. The virus value is about 8.45 times the protozoan values.
These values apply within the specified public drinking water regulatory framework and are based on 254 nm light from low pressure mercury lamps. They are not universal sizing thresholds for every application or LED wavelength. Other lamp types require demonstration of equivalent germicidal dose through reactor validation in that framework. A 40 mJ/cm² specification therefore does not automatically support four log virus credit.
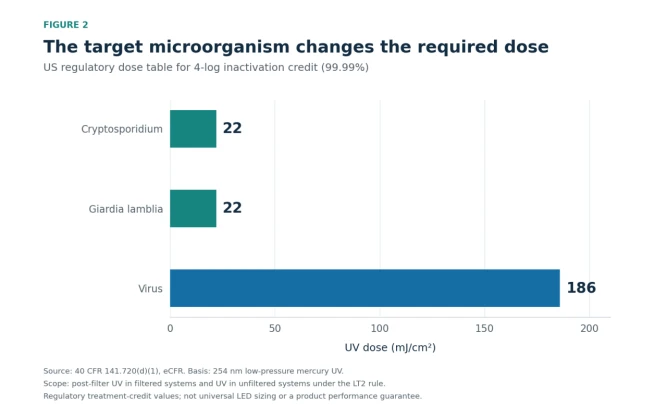
Figure 2. Regulatory doses for four log inactivation credit. Source: 40 CFR 141.720.
Water quality changes how far UV travels
UV transmittance, or UVT, describes the fraction of light passing through water at a specified wavelength and path length. For conventional UV water treatment, it is commonly reported at 254 nm through 1 cm. A visually clear sample is not a substitute for this measurement.
An illustrative Beer–Lambert calculation makes the effect visible. For homogeneous absorbing water, transmission across five centimetres equals the fifth power of the one centimetre transmission. Water measuring 95%, 85% and 75% UVT therefore transmits approximately 77.4%, 44.4% and 23.7% across that distance, respectively.
Figure 3 is a calculated optical example, not measured reactor performance. It excludes scattering and reflections, and its percentages cannot be converted directly into microbial reduction or delivered dose. Its practical message is that a rating established with high UVT water should not be transferred to lower UVT water without supporting performance data.

Figure 3. Calculated light transmission using Beer–Lambert attenuation. UVT is defined at 254 nm over 1 cm.
Turn matching into a purchasing specification
Start the enquiry with the application, required microbial reduction, peak flow and lowest expected UVT. Use actual operating conditions rather than an average daily consumption figure. Ask how the proposed system will perform during simultaneous demand, seasonal water changes and the end of the stated lamp or module service interval.
An illustrative procurement brief might request 3.6 m³/h at 40 mJ/cm² with a minimum UVT of 85% at 254 nm. Those numbers describe a design request, not a verified product capability. A quotation showing the same flow only at 95% UVT leaves a critical question unanswered. The supplier needs to provide applicable evidence, propose suitable pretreatment or revise the selection. Increasing the nameplate wattage without checking the operating conditions does not close that evidence gap.
Request a model specific performance report and its limits. EPA's UV Treatment Toolkit explains that validation evaluates a reactor across operating conditions; its dose assessment includes a validation factor rather than treating every reported reduction equivalent dose as the final validated dose. This distinction matters when comparing a laboratory result with a commercial system claim.
For an OEM project, put the acceptance conditions in writing: target dose or microbial reduction, maximum flow, minimum UVT, temperature range, maintenance assumptions and required monitoring. Confirm whether the evidence covers the exact chamber, light source and controller being supplied. A component certificate cannot answer all those system performance questions.
Check operating safeguards and supporting evidence
Also define what happens when treatment conditions move outside the accepted range. Ask whether the system detects inadequate UV intensity, excessive flow or a failed light source, and what action follows. An alarm that informs an operator and an interlock that stops water serve different operational needs. Choose the response around the application and its approved treatment design, then confirm installation, commissioning and maintenance responsibilities.
Review the complete test report rather than a headline percentage. Record the tested flow, water conditions, organism, reactor configuration and service assumptions. If a report leaves any of these unspecified, request clarification before using its result to support the specific proposed installation.
For UVC LED proposals, ask for the emission wavelength and the conditions used in the microbial test. Do not transfer results from a different wavelength, organism or reactor configuration. The relevant evidence is the performance of the supplied system within its documented operating range.
Compare energy use only after both proposals meet the same treatment objective under comparable conditions. Include replacement parts, servicing and any pretreatment in the commercial comparison. A cheaper or lower wattage unit offers little value if its documented operating range excludes the installation.
Choose by performance
Choose a UV system that meets the required dose at the actual peak flow and water quality. Compare power and cost after confirming that performance.


